

You’re always looking for ways to improve your store’s bottom line, right?
Well – there’s good news:
RepairDesk 2.0’s newly released Dashboard module comes with comprehensive POS analytics designed especially for repair shops! With this data-packed module, you’ll get the store insights you didn’t know existed. A complete ‘magnifying glass’ solution to help you zoom in on your business nitties – see how everything’s going by the numbers.
Sound good?
The Dashboard is meant to be your go-to for making informed, critical business decisions. Your oracle for when you want answers to consequential questions like:
- How to plan employee shifts to address the busiest days of the week?
- How to detect employees’ abnormal sales behavior (a potential concern)?
- Which employees are good at upselling what items?
- Which marketing avenue (Google, Facebook, etc.) is performing better?
Let’s start with a basic outline of the feature – get you acquainted with the works.
Dashboard Overview
The RD 2.0 Dashboard is an interactive, customizable utility that helps you keep a 360-degree view of your repair shop. This means that all important, updated workflow specs will be at your fingertips 😎.
In addition, you can use different charts in your Dashboard to create a storyline that follows a logical analytical progression; such as the combo:
- Number of tickets created
- Amount of revenue from tickets made
- COGS
- Profit/Loss Statement
This way you can visualize the progress of your repair store at different stages in just a glance!
How to Access the POS Dashboard
The Dashboard can be easily accessed from the left menu of the RD 2.0 home screen; along the path ‘Homescreen’ > ‘Reports’ > ‘Dashboard’.
The dropdown menu option makes it easy to store/deploy multiple dashboards.
Filters
Monitor your store performance across different time periods by switching between daily, weekly and monthly filters. The filters marked will apply to all the charts in the selected dashboard.
Scorecards (we call them ‘Metrics’)
The top-page row provides space for 4 scorecards or metrics – best for tracking store KPIs.
Successful business owners, of course, consider monitoring these measures pivotal to their organizational growth (and so should you).
Focus Area (for most-frequently-viewed chart placement)
The focus area provides the largest screen space reserved (by far) for any widget box. Ideally, you should keep this spot for monitoring progress or comparisons. For example, a good utilization here would be to track the busiest days of the week. The idea is to enable easier, snap decisions against a prominent benchmark – with minimum visual interference.
Charts Grid (for detailed POS analytics chart placements)
The bottom-page space allows for 3 widget deployments per row. In total, the entire dashboard screen can accommodate 28 charts – with the remaining bulk integrated into this space. On the first startup, 10 charts come loaded by default (which can be maintained or changed as needed).
Add New Charts
Make your dashboard more strategically/operationally meaningful by adding more charts to it.
New charts can be added through a top-right button – as shown below.
Clicking here will display a dialog box from where you can add more charts to the dashboard.
Replace an Existing Chart
Is a particular chart not making sense?
Simply replace with another one. Easy 😎.
Drag any Chart Around
Rearrange charts in a logical manner to craft an enlightening ‘Dashboard Story’.
Most other dashboards – in other applications – never make any sense because they are not linked in the right sequence.
Save a Chart as an Image
You can save a chart (complete with its X- and Y-axis curves) as an image.
A Pro Tip: Use these snaps to flaunt the number of tickets (or employee commissions) you deal per month on social media 😉.
Helpful Tooltips Everywhere…
Easily make sense of the charts by hovering over chart elements and reading their tooltips.
Export Dashboard in PDF
The entire page (Dashboard Feed) can be downloaded as a PDF report from the top-right corner of the page – as shown. This documentation can prove very useful for updating your partners or investors.
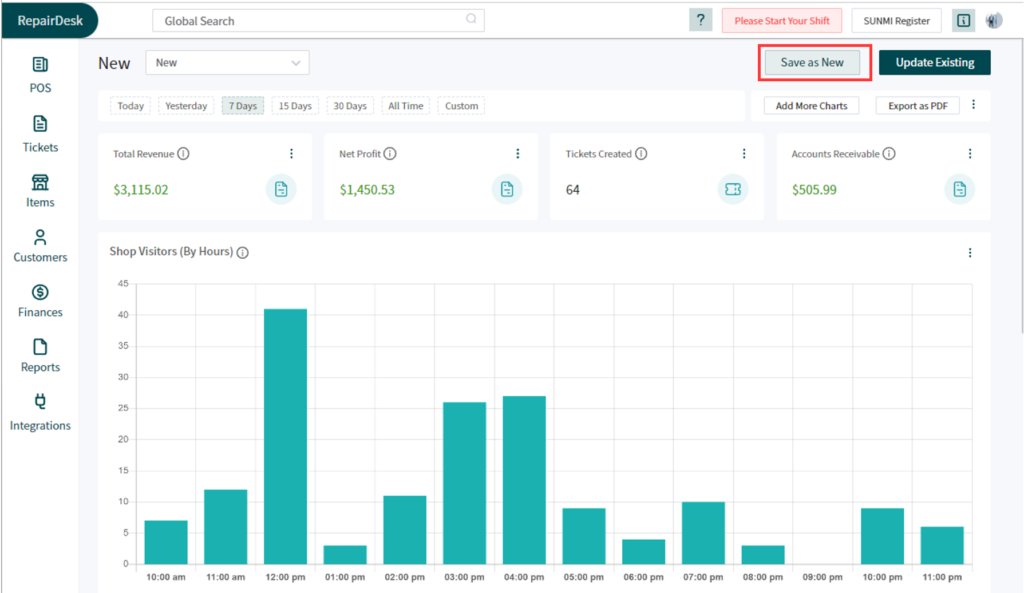
Save as New Dashboard
You can always modify a Dashboard, add totally different charts and their combinations, and save. Further, you can also specify user (access) permissions from the ‘User Permissions’ module.
By now, we know your mind would be buzzing with a lot of queries.
Natural prompts like:
Can I analyze customer data with RepairDesk POS?
And the answer:
RepairDesk POS actively tracks all your store’s repairs, customers, and tickets activity. You can analyze this information in a variety of ways and make informed decisions – all backed by actionable data.
Once you’re all tuned to tracking the figures through your RD 2.0 Dashboard interface, you can forget about any process blind spots that might have hindered you in the past. Indeed – we can guarantee that nothing important will escape.
Subscribe to our newsletter for more exciting content on tips for getting the most out of the Dashboard and POS Analytics.


