

Every repair business owner wants to stay informed about how their business is doing, right? That’s how we know how much y’all love RepairDesk reporting. It keeps track of everything; your sales, inventory, employees, customers, and stores with separate reports. Well, guess what? It has gotten even better. With a brand-new KPI Dashboard in your repair shop software, you’ll get all the info you need to manage your store, except this time, you’ll have everything on ONE SCREEN.
We call it the KPI Dashboard because it has all the Key Performance Indicators to show you how your store is doing and where you stand as a business.
Here, have a look!
The KPI Dashboard extracts all the important bits of all reports and unites them in one space. So whenever you log into your RepairDesk account, you instantly get a happy face!
Learn the complete breakdown of all the numbers on your KPI Dashboard from our knowledge base article on Employee and Store KPIs. Now, let’s see what these numbers can do for you.
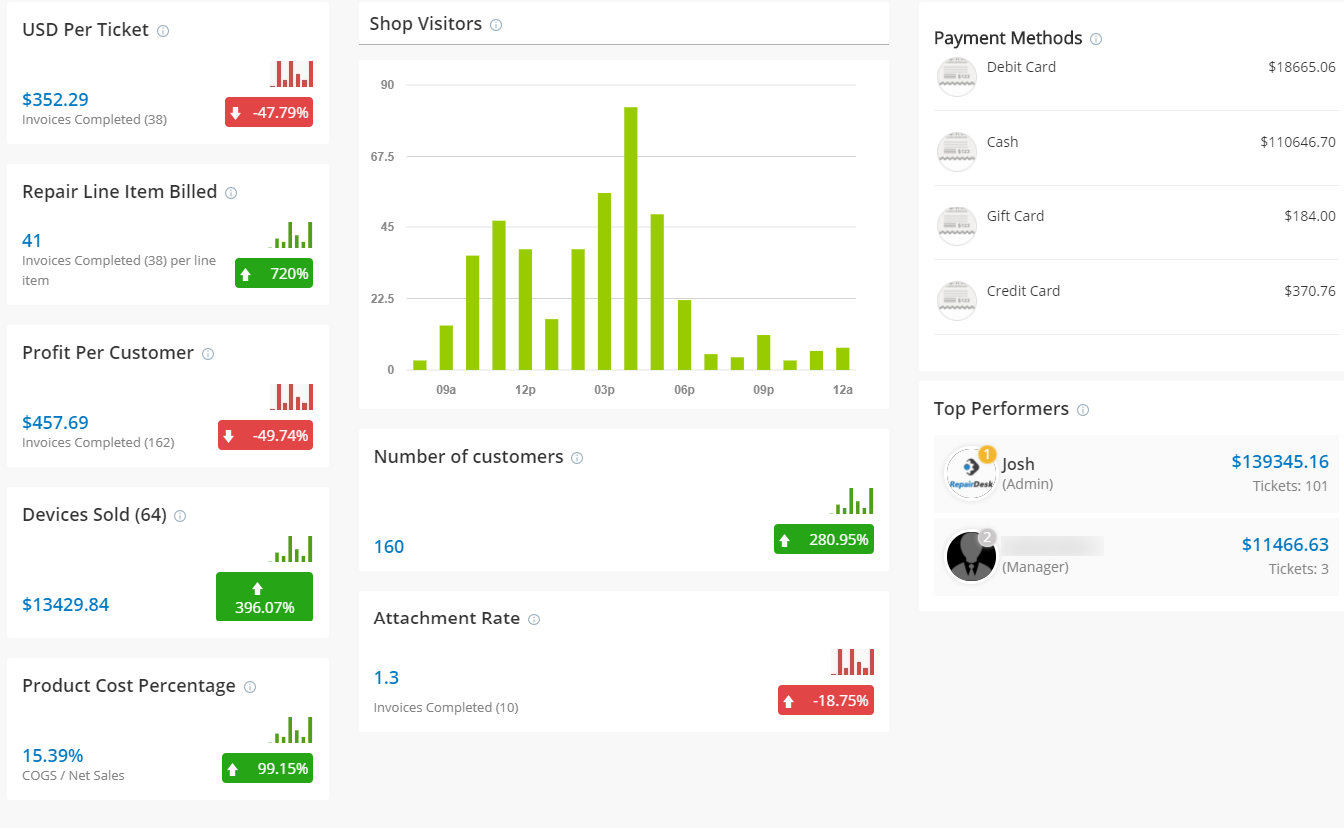
Shop Visitors
Click on the Store KPIs and the very first thing you notice is the shop visitors graph. It’s a quick visual representation of the hottest and busiest times of your day. What can you use this information for? To save your energy, gear up, and get everything ready to best entertain your customers and close as many deals as you can.
Payment Methods
Listed on the right side of your KPI Dashboard screen, these numbers give you a better insight into your most popular payment methods and how much you have collected from each one. Using this information, you can extend the services for the ones that are working and terminate for the ones that are not. Simple!
Product Cost Percentage
The system will divide the cost of your sold accessories and other items by their sale prices and let you know if the total cost is greater or lesser than your total sales. If this percentage is positive, you should be alarmed. Because it means that you are not profiting from your sales and that you paid more for those items than you earned off of them.
What will you do then? Analyze your Sales by Item report to see which items were sold at a lower price than they were bought at. Then to see why, you can go to the Customer-wise Sales report. Was it a special discount, did the customer use loyalty points for their purchase, or was it something else? Find the root and work on turning your product cost percentage red, and not green.
Other Pointers
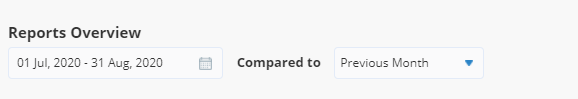
- By default, the dashboard shows the store KPIs for this month, which are also compared to the ones from last month, and the difference is shown in percentage with a green or red label. You can change the comparison report as per your preference from the dropdowns.
- The default KPI Dashboard view is for the store you are currently on. To select a different store or view combined KPI scores of all stores, change the filter.
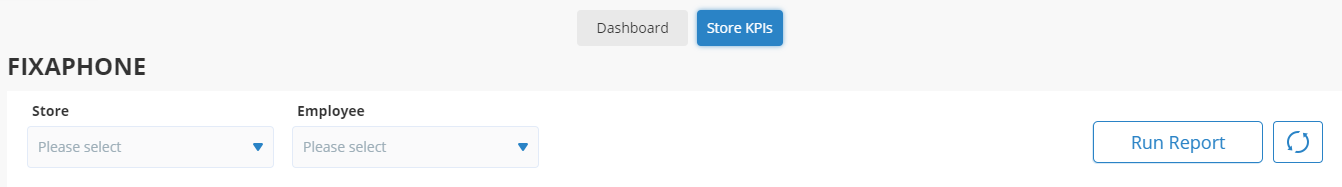
- You can also check out the performance of your employees by selecting their name from the above filter.
- We have also taken care of your privacy needs with different dashboard views for admin and employee accounts. Store KPI dashboard for you (the admin) and Employee KPI Dashboard for your employees.P.S. You can control what your employees can and cannot see on their KPI screen from Employee Roles and Permissions.
End Note
RepairDesk has promised you the superpower of running your repair business. Your success is in the hands of how you use that power. Our new KPI Dashboard will let you know if you are doing a job at it or not, so you can build upon your performance. We hope your KPI scores go up and paint your dashboard green.


